

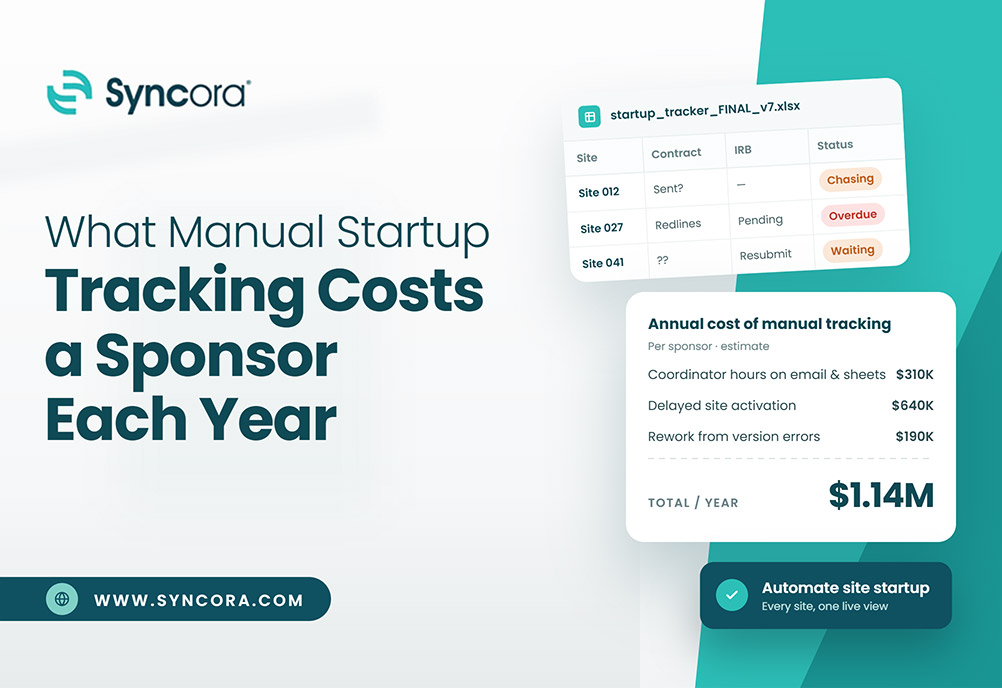
Every day a site spends chasing signatures, or updating spreadsheets is a day that delays patient enrollment. That single delay rarely stays contained to one site or one task.
Key Takeaways:
- Manual tracking during study startup adds real delay costs per site, per day
- Coordinators lose hours each week to spreadsheets and email chains instead of patient-facing work
- Data reconciliation errors during manual handoffs extend startup cycle time
- Centralized tracking can lower site activation cost per site and speed first patient in
- Small process gaps compound across a full study, not just one location
Quick Answer:
Manual startup tracking costs you real money through lost coordinator hours, delayed first patient in dates, and document errors. A single week of delay across multiple sites can add measurable expense to your trial budget. Therefore, the cost of study startup delays rarely comes from one dramatic failure. Instead, it builds gradually through fragmented spreadsheets, duplicate data entry, and slow regulatory tracking. If you rely on manual methods, you may be underestimating how much staff time and calendar time these small inefficiencies consume, especially once multiple sites are involved.
Introduction
Study startup rarely fails because of one big mistake. Instead, it slows down through dozens of small manual tasks that pile up quietly. A missing signature here, a spreadsheet update there, and suddenly a site activation date slips by two weeks.
For sponsors, this adds up to real money. This article breaks down the cost of study startup delays, where manual processes create the most friction, and what that friction means for your coordinator hours, your first patient in date, and your overall study startup costs across a full trial.
How Much Does Study Startup Delay Really Cost a Sponsor?
Clinical trial delay costs extend well beyond the obvious calendar slip. When your startup timeline stretches, two costs hit you at once.
-
Direct Operational Burn:
First, you keep paying to sustain active study infrastructure, including CRO oversight, core laboratory contracts, and monitoring resources, which runs roughly $40,000 per day in ongoing operational overhead.
-
Opportunity Cost and Patent Exclusivity:
Second, a single day of delay in bringing a therapeutic product to market costs sponsors approximately $800,000 in lost sales revenue, depending on whether the drug is a targeted therapy or a potential blockbuster.
Because sponsors typically budget site activation on theoretical timeline averages, reliance on manual email exchanges and disparate tracking sheets almost inevitably turns manageable schedules into major budget variances.
Where Do Manual Processes Slow Down Site Activation?
Study startup (SSU) encompasses feasibility, contract execution, budget negotiation, institutional review board (IRB) review, and essential regulatory document collection. Historically, SSU represents nearly half of the total clinical trial timeline.
When teams track these stages through manual tools, workflow bottlenecks concentrate around three friction points:
- Document Collection via Email: Essential regulatory documents (Form FDA 1572, financial disclosures, CVs, and medical licenses) pass through multiple hands via email attachments. Missing version numbers or signature dates trigger iterative review cycles that stall approval.
- Decentralized Status Trackers: When ten or twenty sites operate on standalone spreadsheets, no single source of truth exists. A coordinator must manually alert sponsors, CRO monitors, and regulatory specialists every time an amendment or credential updates.
- Rework Loops: Discrepancies identified during manual quality cross-checks force teams to repeat work already completed weeks earlier.
What Is the Cost Per Day of a Clinical Trial Delay?
The day-to-day impact of manual startup tracking becomes easier to see once you break it down by task. Below is a simplified view of where manual tracking typically adds delay during startup.
| Cost Driver | Manual Process Impact | Estimated Delay Added |
|---|---|---|
| Site document collection | Email or fax-based exchange, signature chases | 5 to 10 days per site |
| Regulatory tracking | Outdated, siloed spreadsheets | 3 to 7 days per site |
| Coordinator data entry | Duplicate entry across sponsor and CRO portals | 4 to 8 hours per week |
| Data reconciliation | Manual cross-checking of tracker versions | 2 to 5 days per cycle |
| First patient in readiness | Fragmented visibility into site milestones | 7 to 14 days |
These delays look small individually. However, if five sites each slip by ten business days due to manual back and forth, the combined effect can push your interim analysis and filing deadlines back by months, all while your trial infrastructure keeps running at roughly $40,000 a day in direct cost, as mentioned above.
How Much Coordinator Time Goes Into Manual Startup Tracking?
If your team relies on manual tracking, your coordinators likely spend more time on it than your budget assumes. Industry reporting on site operations has consistently pointed to administrative work, not patient care, as one of the largest drains on a coordinator’s week.
Consider a simple example. At a loaded rate of $65 per hour, six hours a week spent on manual tracking and duplicate entry adds up over a sixteen week startup period. That works out to $6,240 in pure administrative cost per site. Across a twenty site study, the total reaches $124,800.
Every hour your coordinator spends updating a spreadsheet is an hour not spent prescreening patients or scheduling consent appointments.
What Does a Delayed First Patient In (FPI) Actually Cost?
First patient in is the clearest signal of your trial’s momentum. When you manage startup through static sheets and email check-ins, warning signs often stay invisible until you miss your activation date outright. Industry data has repeatedly shown that 80% of trials miss their original enrollment timelines, and startup bottlenecks are frequently the earliest warning sign of that outcome.
Consequently, a delayed FPI compresses downstream recruitment windows, often forcing sponsors to onboard secondary or rescue sites mid-study. When factoring in duplicate legal negotiations, supplemental IRB reviews, CRA travel, and drug supply reallocation, industry budget models estimate that activating a rescue site can easily add tens of thousands of dollars in unbudgeted expense per site.
How Does Manual Data Reconciliation Add Hidden Costs?
Manual tracking introduces real risk of human error into your trial documentation. When regulatory files, expiration trackers, and training logs live in separate spreadsheets, your team can end up working from different versions of the same document.
Trial data is expected to stay traceable back to its original source and remain accurate and current at every step, under standards regulators hold every sponsor to. When staff transcribe information by hand across scattered sheets, keeping that clear trail becomes difficult. Correcting these gaps before an audit often requires costly file cleanup or re-verification work that a centralized system would have caught earlier.
What Is the True Site Activation Cost Per Site?
Calculating your true site activation cost means looking past direct site fees and investigator grants.
True Site Activation Cost = Direct Fees + Internal/CRO Labor + Administrative Friction + Delay Burn Rate
When you add up the hours your team spends reconciling status reports and chasing updates, your true cost to activate a site manually often runs meaningfully higher than your initial budget line suggests.
How Can Sponsors Reduce Startup Operational Inefficiency?
Clinical trial operational inefficiency often comes down to disconnected tools rather than staff performance. Sponsors can reduce study startup costs by centralizing document collection, regulatory tracking, and status updates into one system. Consequently, coordinators spend less time chasing information and more time on tasks that move a site toward activation. A few practical steps include:
- Centralizing site documents in one shared system
- Automating status updates instead of manual check ins
- Setting clear ownership for each startup task
- Reviewing bottlenecks after each study to refine the process
These changes will not eliminate every delay, but they can meaningfully reduce the hours lost to manual tracking across an entire study portfolio.
FAQs
How much does a one day clinical trial delay cost a sponsor?
Research from Tufts CSDD puts the average direct cost of running a Phase II or Phase III trial at approximately $40,000 per day, on top of coordinator hours and administrative overhead lost to manual tracking.
What causes most study startup delays?
Most delays come from manual document exchange, disconnected spreadsheets, and slow regulatory tracking rather than any single major error.
How does manual tracking affect first patient in timelines?
Manual tracking often hides bottlenecks until they cause a visible delay, which pushes back the first patient in date and the rest of the study timeline.
Can site activation cost per site be reduced without adding staff?
Yes. Centralizing tracking tools often reduces cost more effectively than adding staff, since it removes duplicate manual work rather than redistributing it.
What is the average startup cycle time for a clinical trial site?
Startup cycle time varies widely, but manual processes typically add several weeks compared to sites using centralized tracking systems.
Conclusion:
Manual startup tracking rarely causes one large failure. Instead, it adds small delays across documents, data entry, and reconciliation that compound over an entire study. These costs show up in coordinator hours, first patient in timelines, and overall study startup costs, even when no single step looks like the problem.
Sponsors who take a closer look at their startup process often find more room for improvement than expected. Small fixes at the document and tracking level tend to produce the biggest gains over time. If your team is ready to reduce the cost of study startup delays, Syncora can show you where manual tracking still shapes your site activation timeline today, and how that timeline affects patients waiting to enroll.


